
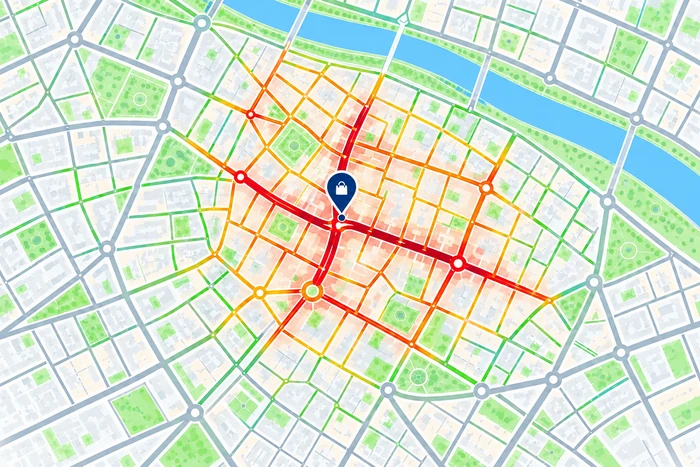
 Higher footfall
LowerHigher
Illustrative exampleStrategic identification
Identify streets and areas with higher footfall to maximise visibility and commercial opportunities.
Footfall
Footfall is a key factor in evaluating commercial locations, measuring actual visibility and making decisions based on urban mobility in Spain.
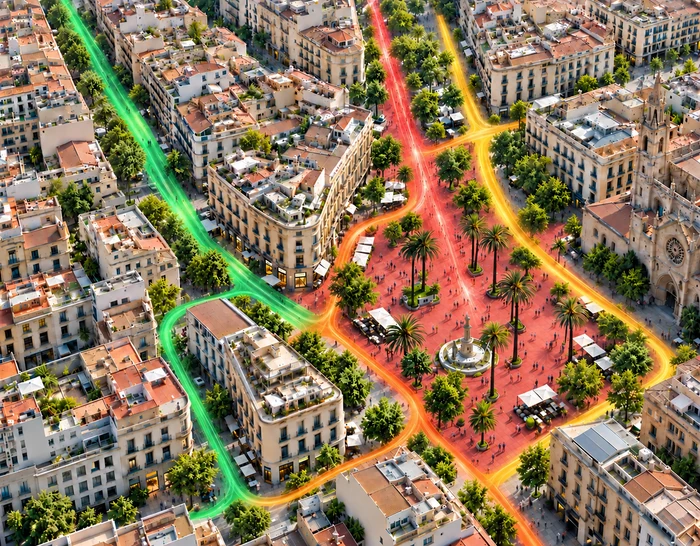
Find the busiest streets, compare alternatives and understand how footfall changes throughout the day.
Higher footfallIdentify streets and areas with higher footfall to maximise visibility and commercial opportunities.
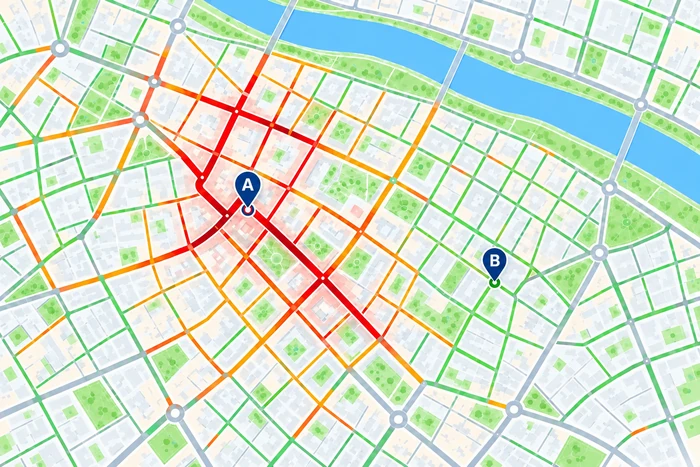
Avoid locations with low footfall that could limit your business’s performance.
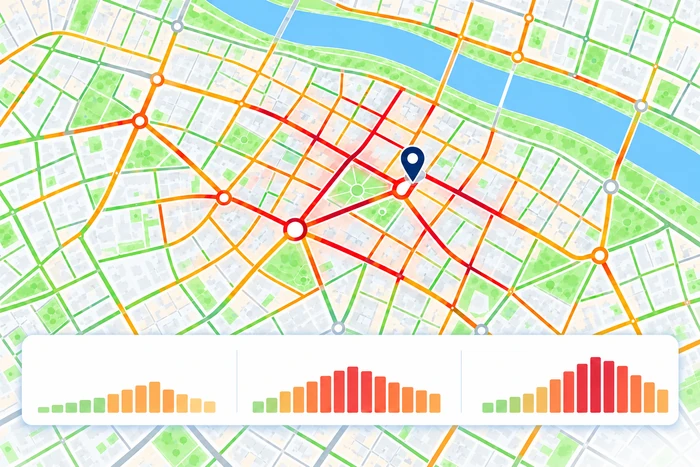 The rhythm of the street
Adjust your strategy to hourly patterns, busier days and footfall trends.
Pickgeo Traffic combines geospatial data and analytical models to present footfall clearly, visually and in an easy-to-interpret format, even for non-technical users.
Define the street or area you want to analyse directly on the map.
Explore footfall by hour, day and period to understand actual behaviour.
Interpret the data using heat maps and simple charts.
Evaluate different areas using objective metrics and make informed decisions.
The tool provides clear, actionable indicators to assess a location’s potential:
Access basic data for free or purchase more detailed reports according to the level of analysis you need. No mandatory monthly subscriptions.
Basic mobility data completely free.
BEST OPTION
Complete mobility analytics.
Simple mobility analytics.
We answer common questions about footfall analysis and how the tool works.
It is the measurement of people passing along a street or through a specific area.
Yes. The data are broken down by hour, day of the week and month.
No. The tool is designed for non-technical users.
Yes. Mobility indicators are updated periodically.
Yes. You can easily analyse and compare different locations.