01 / Demographics
Who lives here and how the area changes
Population profiles, age distribution and changes in the surrounding area to put the location in context.

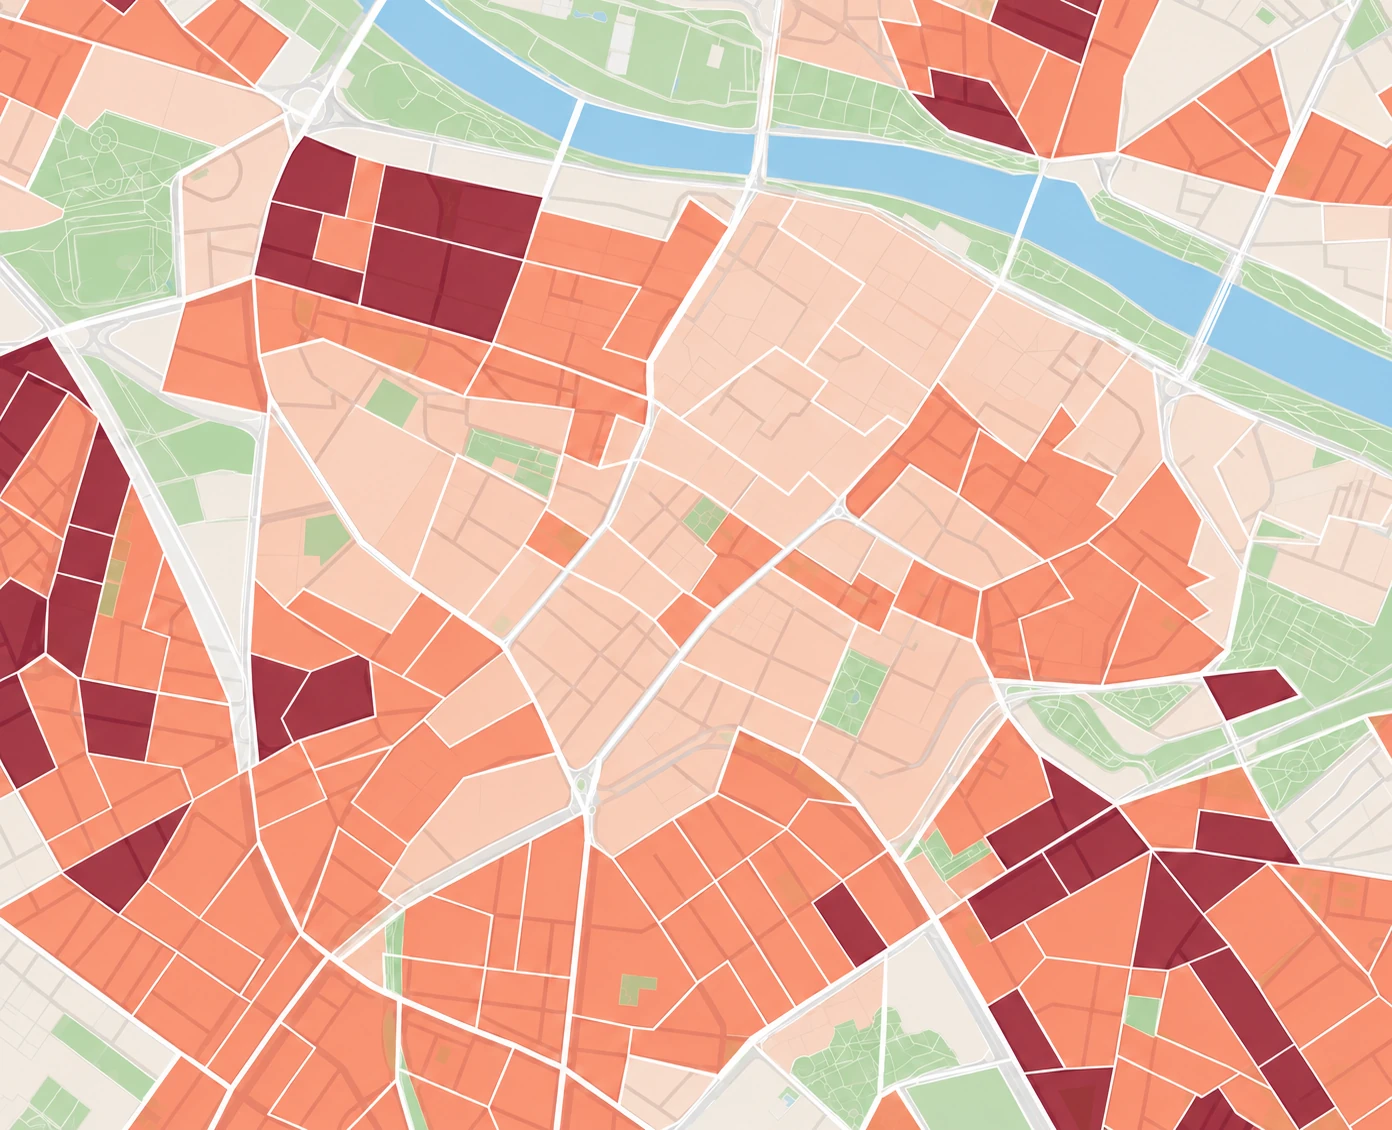
Population density
12,017people/km²
Illustrative example
Geospatial data for businesses
Pickgeo is the location intelligence platform for businesses and public administrations that need to decide where to invest, open or grow, using clear, visual, actionable data across different markets.

One location. Five perspectives
You don’t need more maps. You need to know what makes a difference to a decision. Scroll to explore the five layers of data Pickgeo brings together around a location.
01 / Demographics
Population profiles, age distribution and changes in the surrounding area to put the location in context.

Population density
12,017people/km²
Illustrative example
02 / Economy
Income, spending and housing to distinguish an attractive area from one that is simply busy.

Total spending
79,144,935€/km²
Illustrative example
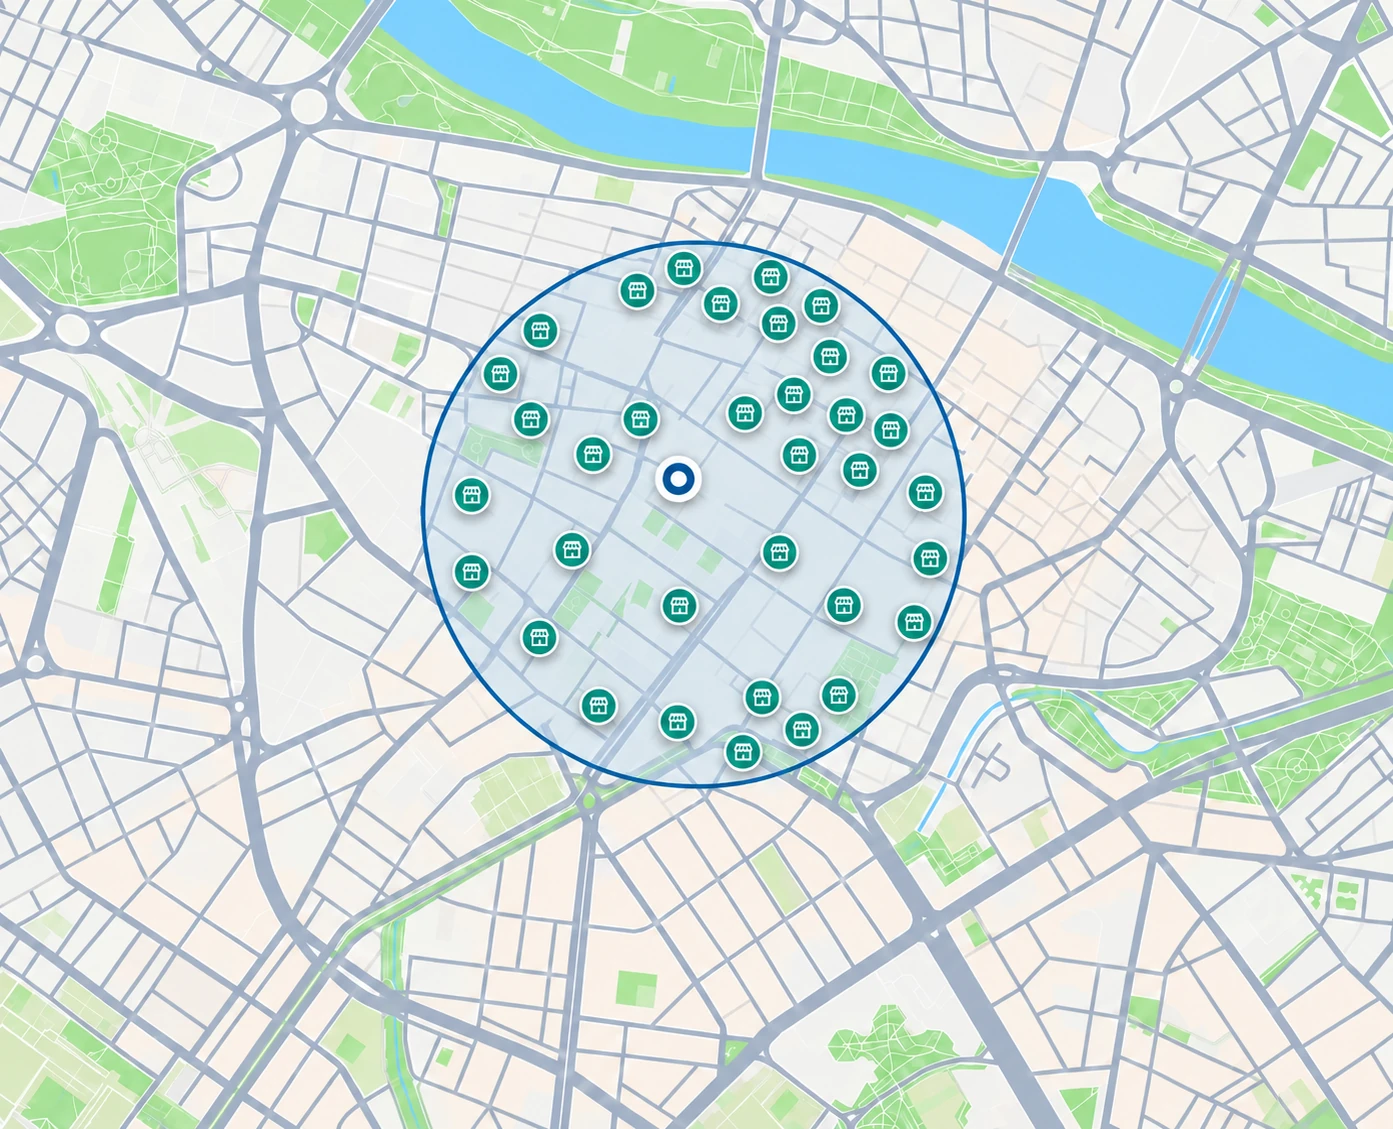
03 / Commerce
Competition, commercial activity and points of interest to identify gaps and saturation.

Commercial environment
126comparable businesses
Illustrative example
04 / Mobility
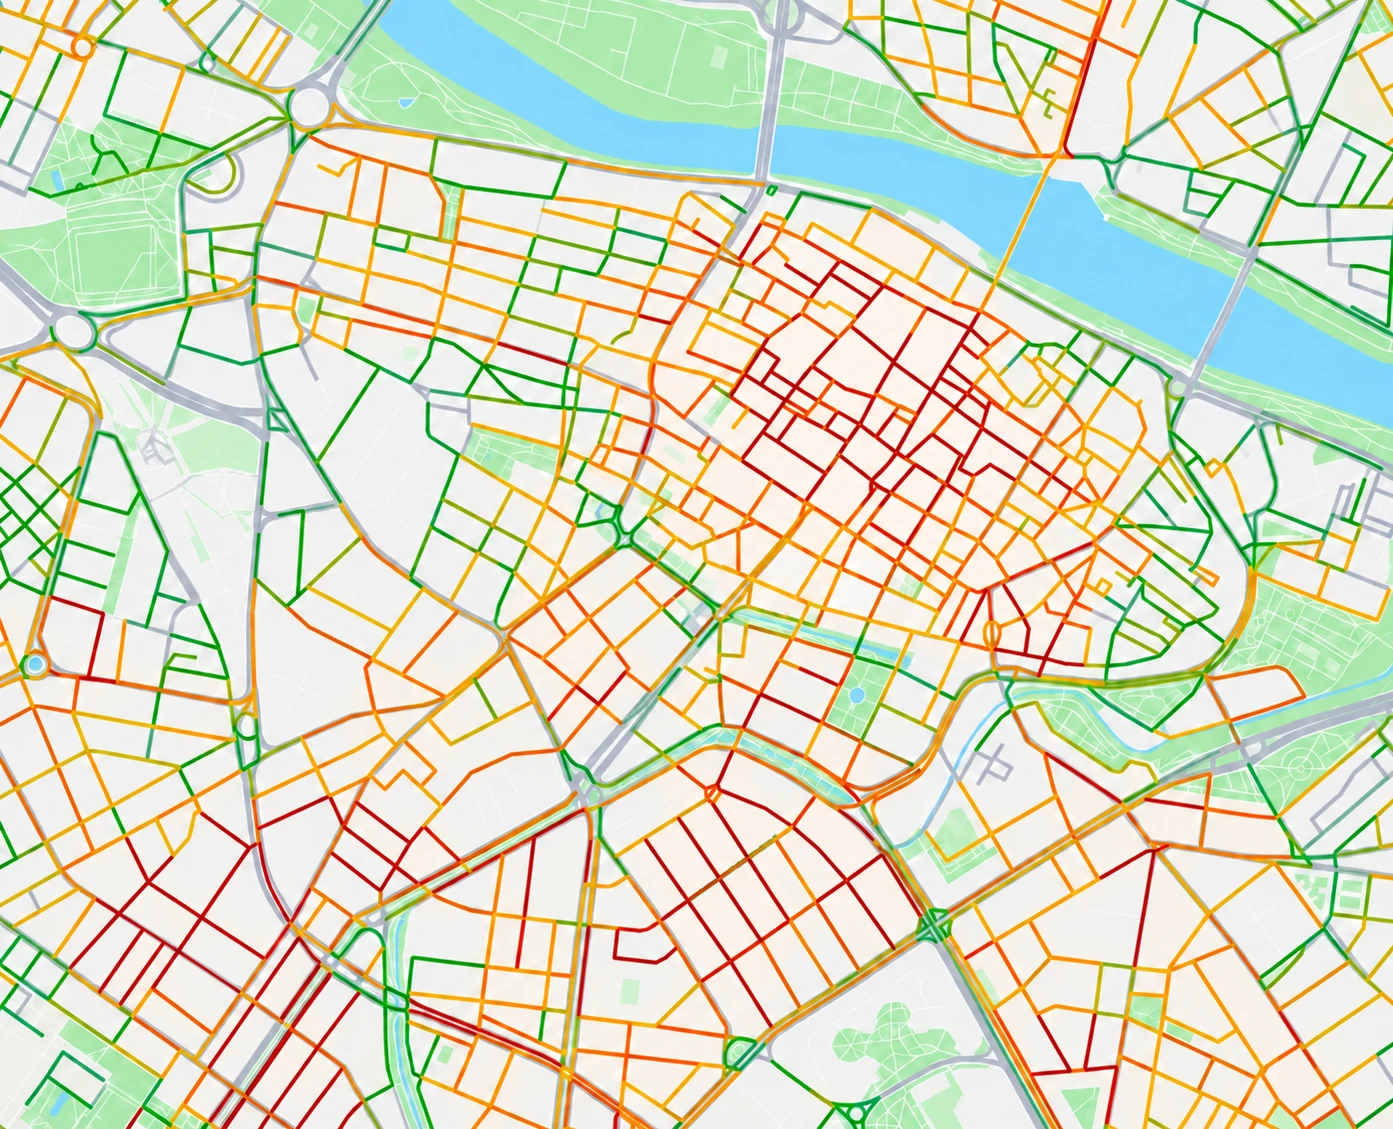
Mobility flows and accessibility to understand the actual catchment area.

Accessibility
18min · average access time
Illustrative example
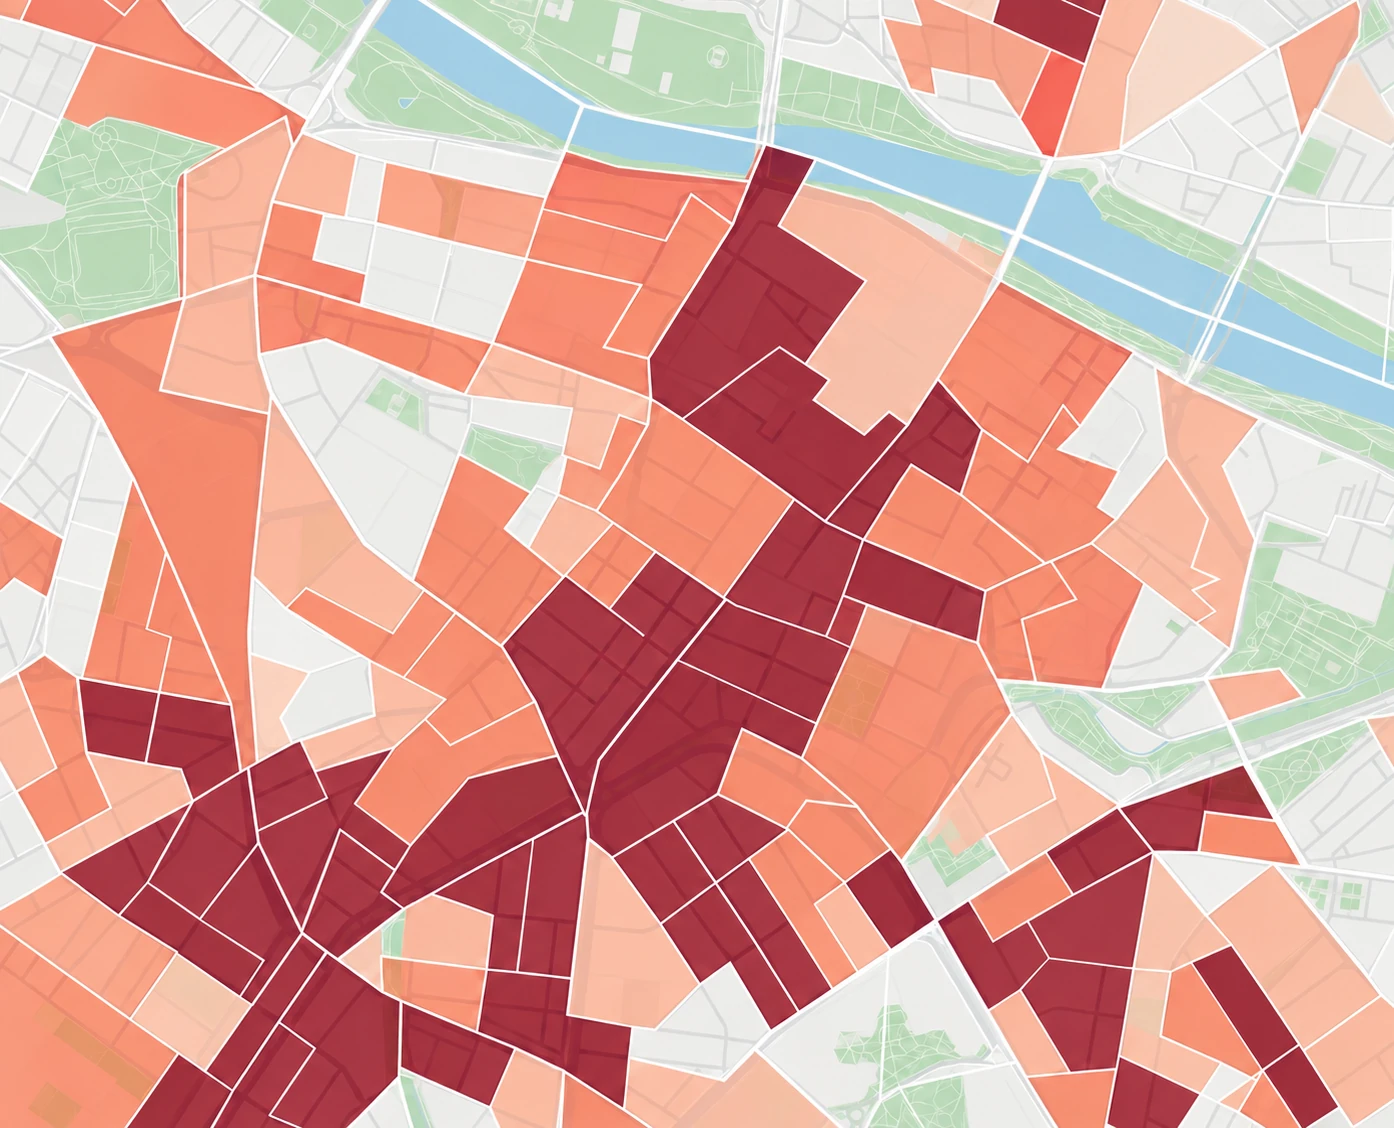
05 / Footfall
Movement patterns around the location to understand intensity, timing and routes.

Footfall
13,052–15,952pedestrians
Illustrative example

Population density
12,017people/km²
Illustrative example
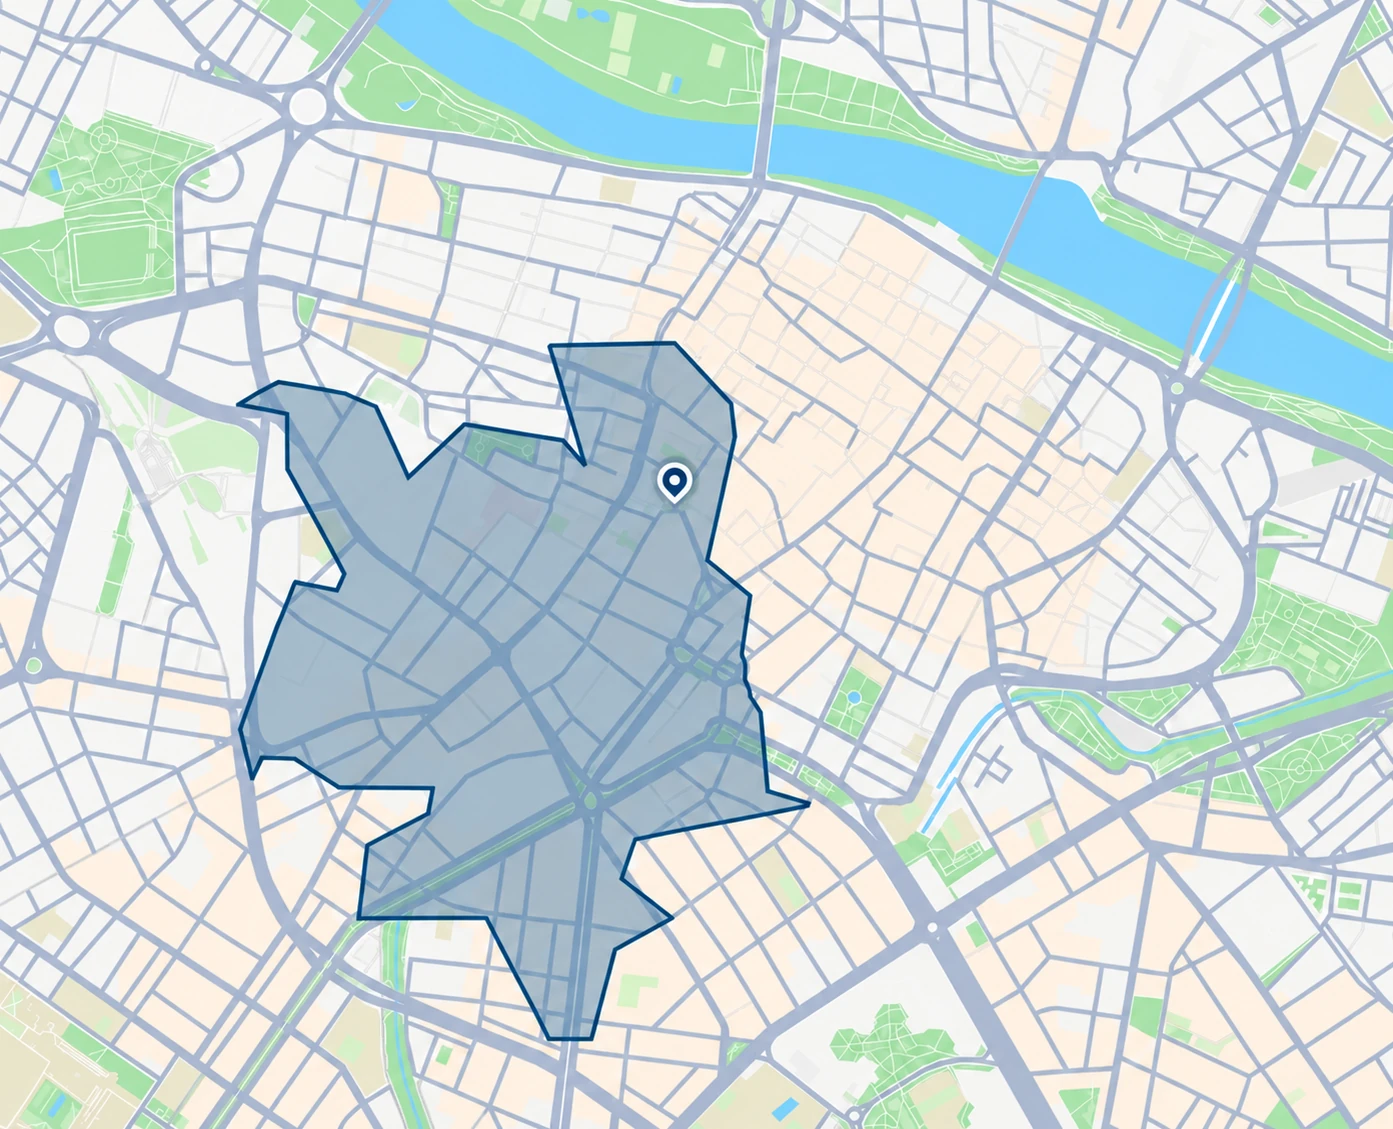
Illustrative example · 01 Scroll to change layers
More than 5,000 users use Pickgeo to understand an area before taking action.
Pickgeo products
With you at every step
We help turn location data into clear decisions. From your first demo to your team’s everyday work.
Our mission: make location intelligence accessible so more organisations can decide with context and confidence.
Getting started
Before you start, we show you how Pickgeo works and how it can fit your use case.
We help configure the platform and train your team to work independently.
Test the solution in a real setting to check that it meets your needs.
We stay alongside you, improving the experience based on usage and your feedback.
No. The platform and reports turn complex territorial data into visual insights. The API provides direct access for technical teams.
Yes. Coverage and detail depend on the product, market and availability of each source.
Each dataset has its own update frequency and date, so you can interpret the results correctly.
Yes. The demo focuses on the decision, sector and area you need to evaluate.